"How Much LEGO?" - A Infograph by Slime

so for my GD II class, we’re having to create these infographics, which if you don’t know, convey statistical information through visual means

the twist?
we had to do something personal to us :scream:

i looked around my room and thought to myself
“hey i think i might like lego a bit”
so i went ahead and used that

this is the end result

stats are from my brickset
apparently i’m a pretty big bionicle fan
who’dve thought

60 Likes

Question,
Misc?
What does miscellaneous entail exactly?

2 Likes

That is cool, in one of my classes we are writing personal statements, and it am trying to twist it using how I would format a post here or
Something like
That…

2 Likes

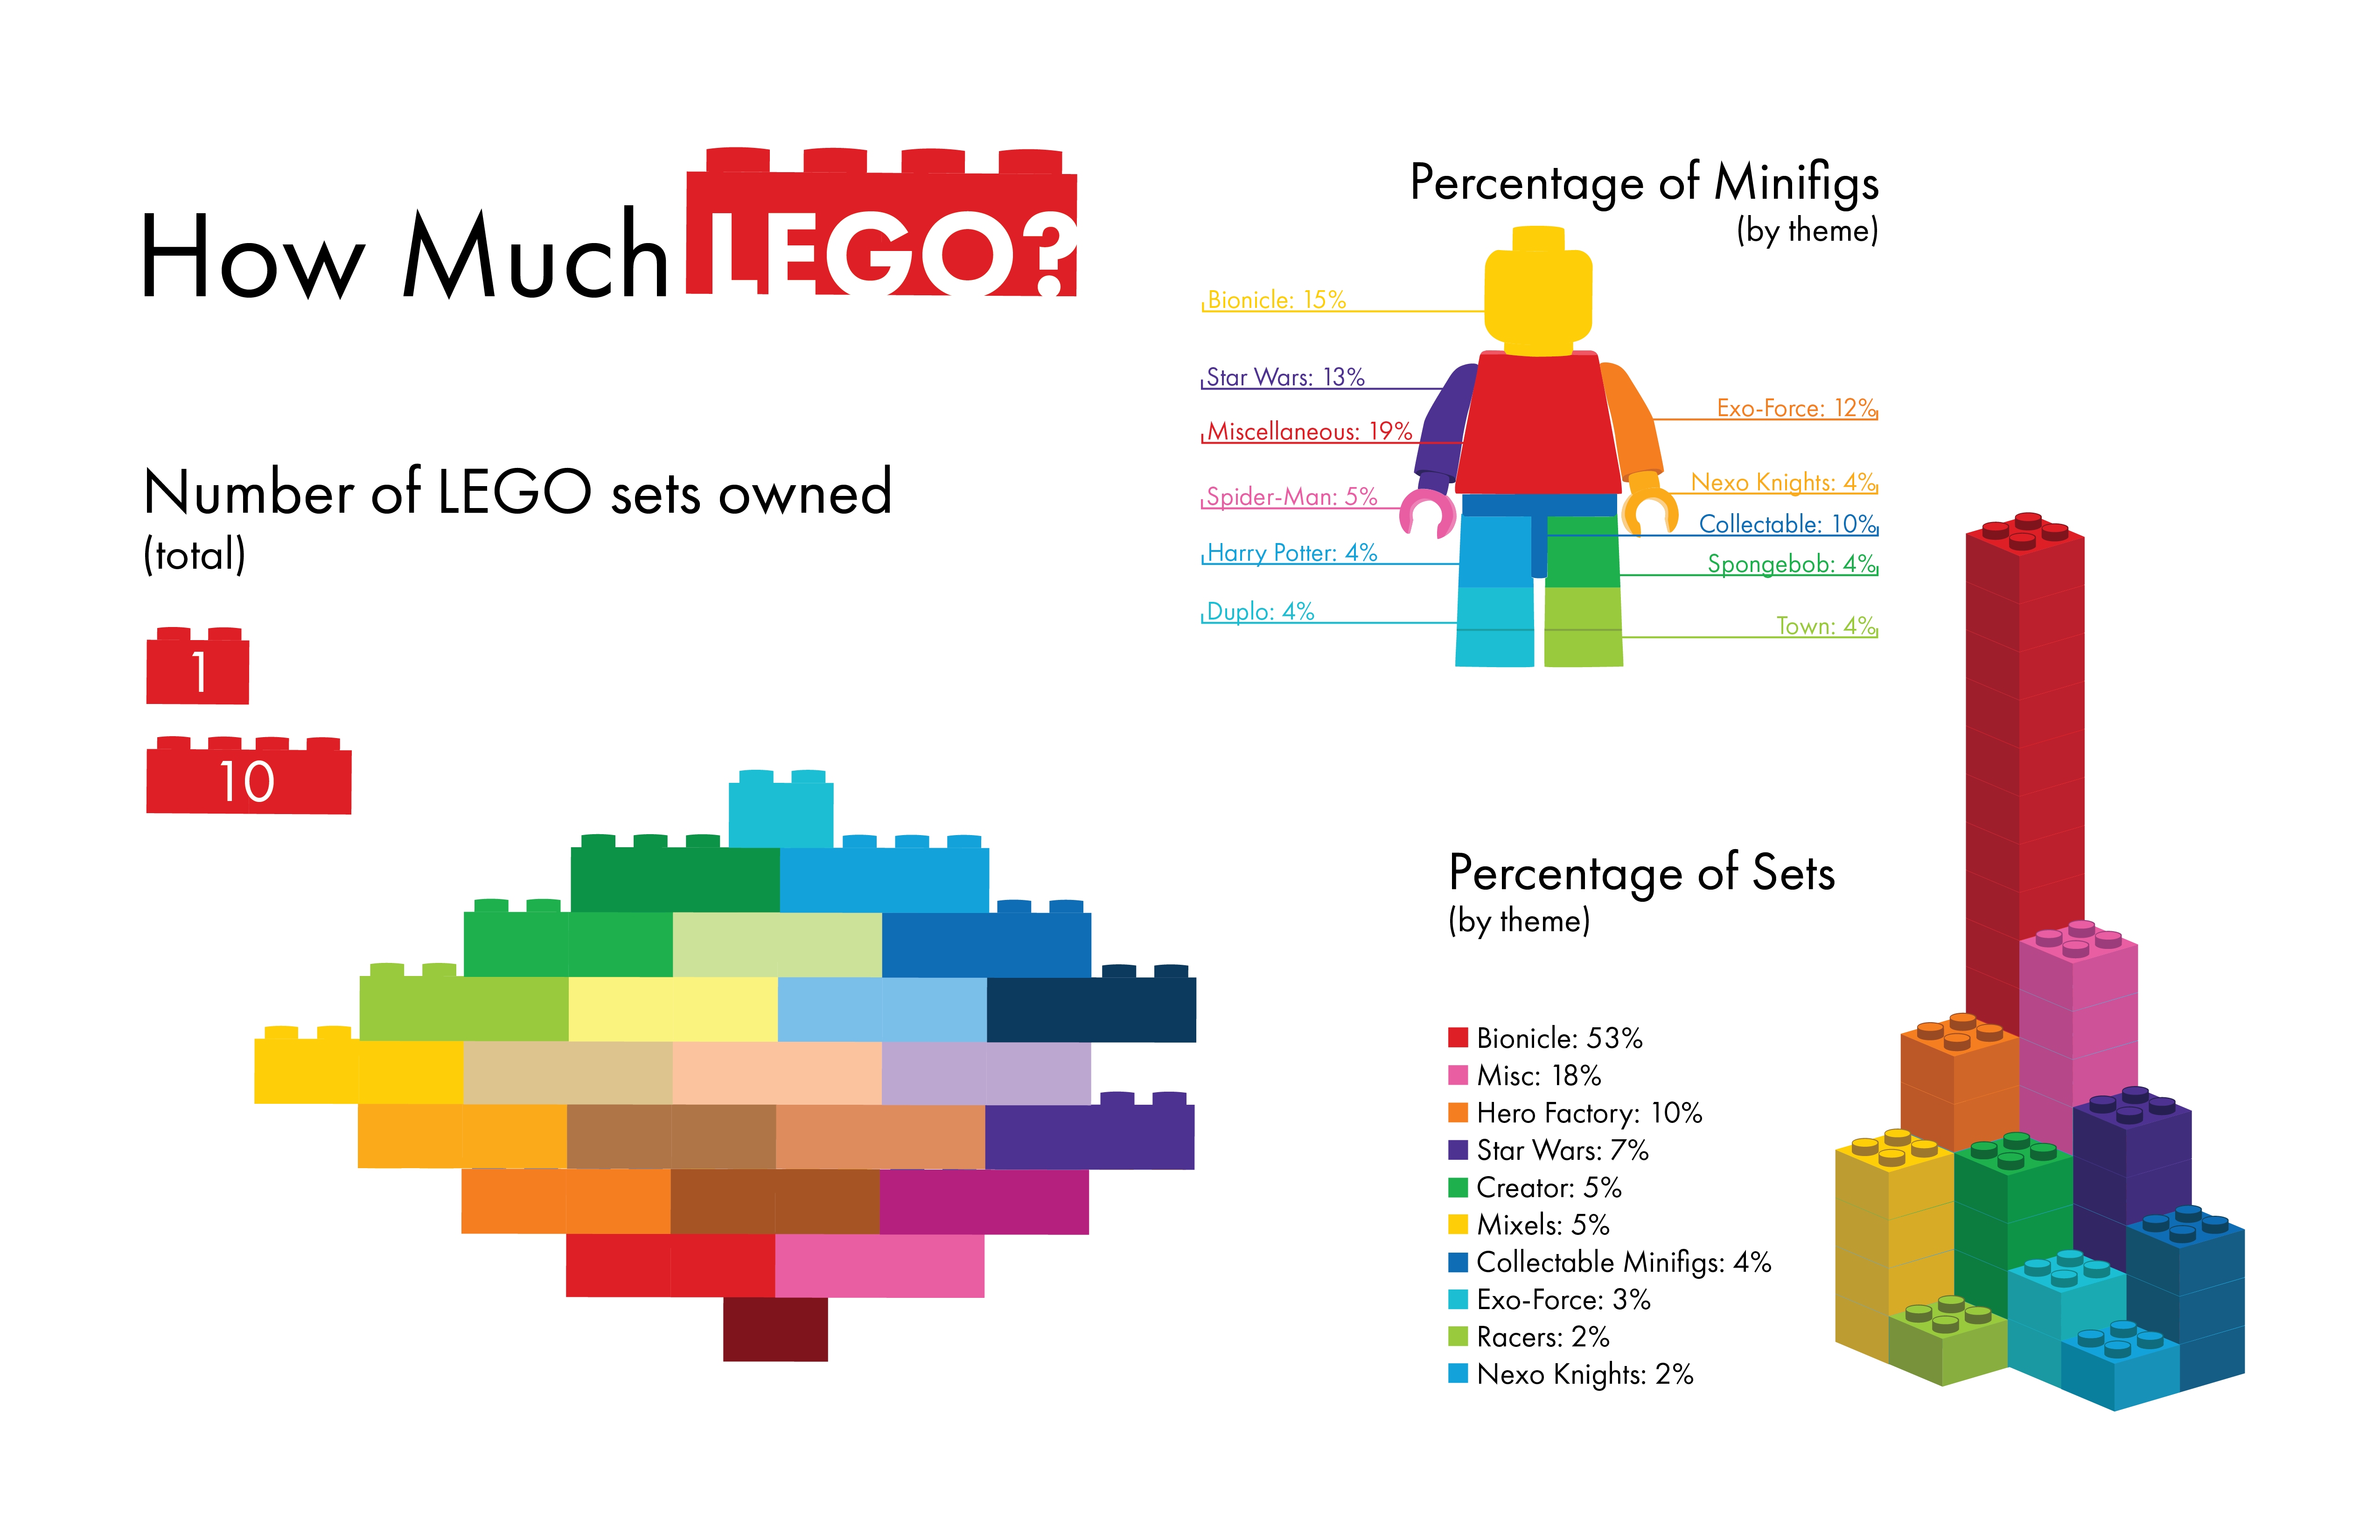
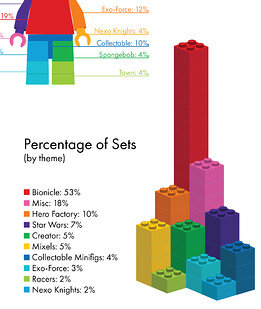
Misc is a collection of various themes that made up 1% or less of my collection, e.g. Board Games or City. It was just too messy keeping such small increments in there.

2 Likes

Really like the styling of it :stuck_out_tongue_winking_eye:

2 Likes

What does Brickset count as a ‘Minifig’ that 15% of your Minifigs are from Bionicle?

2 Likes

I have all 6 Piraka and all 6 Inika.

9 Likes

Oh. I guess that tells me about how many minifigs you have, then.

2 Likes

A very well made graph. It conveys what it needs to nicely and is very colorful.

2 Likes

What is that one in the middle though?

2 Likes

Wait, the middle one looks familiar…
Lego magazine?
!
The board game!
Those were the pieces right?

I always thought they were the same molds as the figs, I didn’t realize they were so tiny.

4 Likes

Pieces from the 2006 Board Game, which I also own. Pic isn’t mine though.

3 Likes

A minifig pie chart?

That’s a new one.

~W12~

2 Likes

Cool chart, but the lack of all Ninjago content pains me.

2 Likes

Why are Mixels only 5%? It’s only Okay if you have them all…

Pretty cool, The yellow is a bit hard to read tho.

2 Likes

Nice man! I’ve been learning info-graphics in graphic design class as well. What program did you use to create it? Illustrator?

1 Like

Yeah, this was all done in Illustrator. :stuck_out_tongue:

1 Like

Sweet! What tool did you use to create the 3D bar chart?

1 Like

It was all pretty much done using the pen tool. To create that graph, I traced out a top view of a brick, then manually copied/pasted them how I wanted. Each one of those bricks is comprised of maybe 11ish objects.

Boi, sweet designs for the graphs. I think they convey the information quite well.
If uh, if you want to expand on your graph-making skillz, I know of a book you should read. Look up Edward R. Tufte and his book The Visual Display of Quantitative Information.
Long title
Short book

Sorry, I just like good graphs.

Anyway, 222 sets? Dang son. Did you keep the boxes or something? There’s no way I’d be able to count all the sets I have so precisely.

2 Likes